Tribology support for IE browser ended on 19 June 2020, Please click here for details.
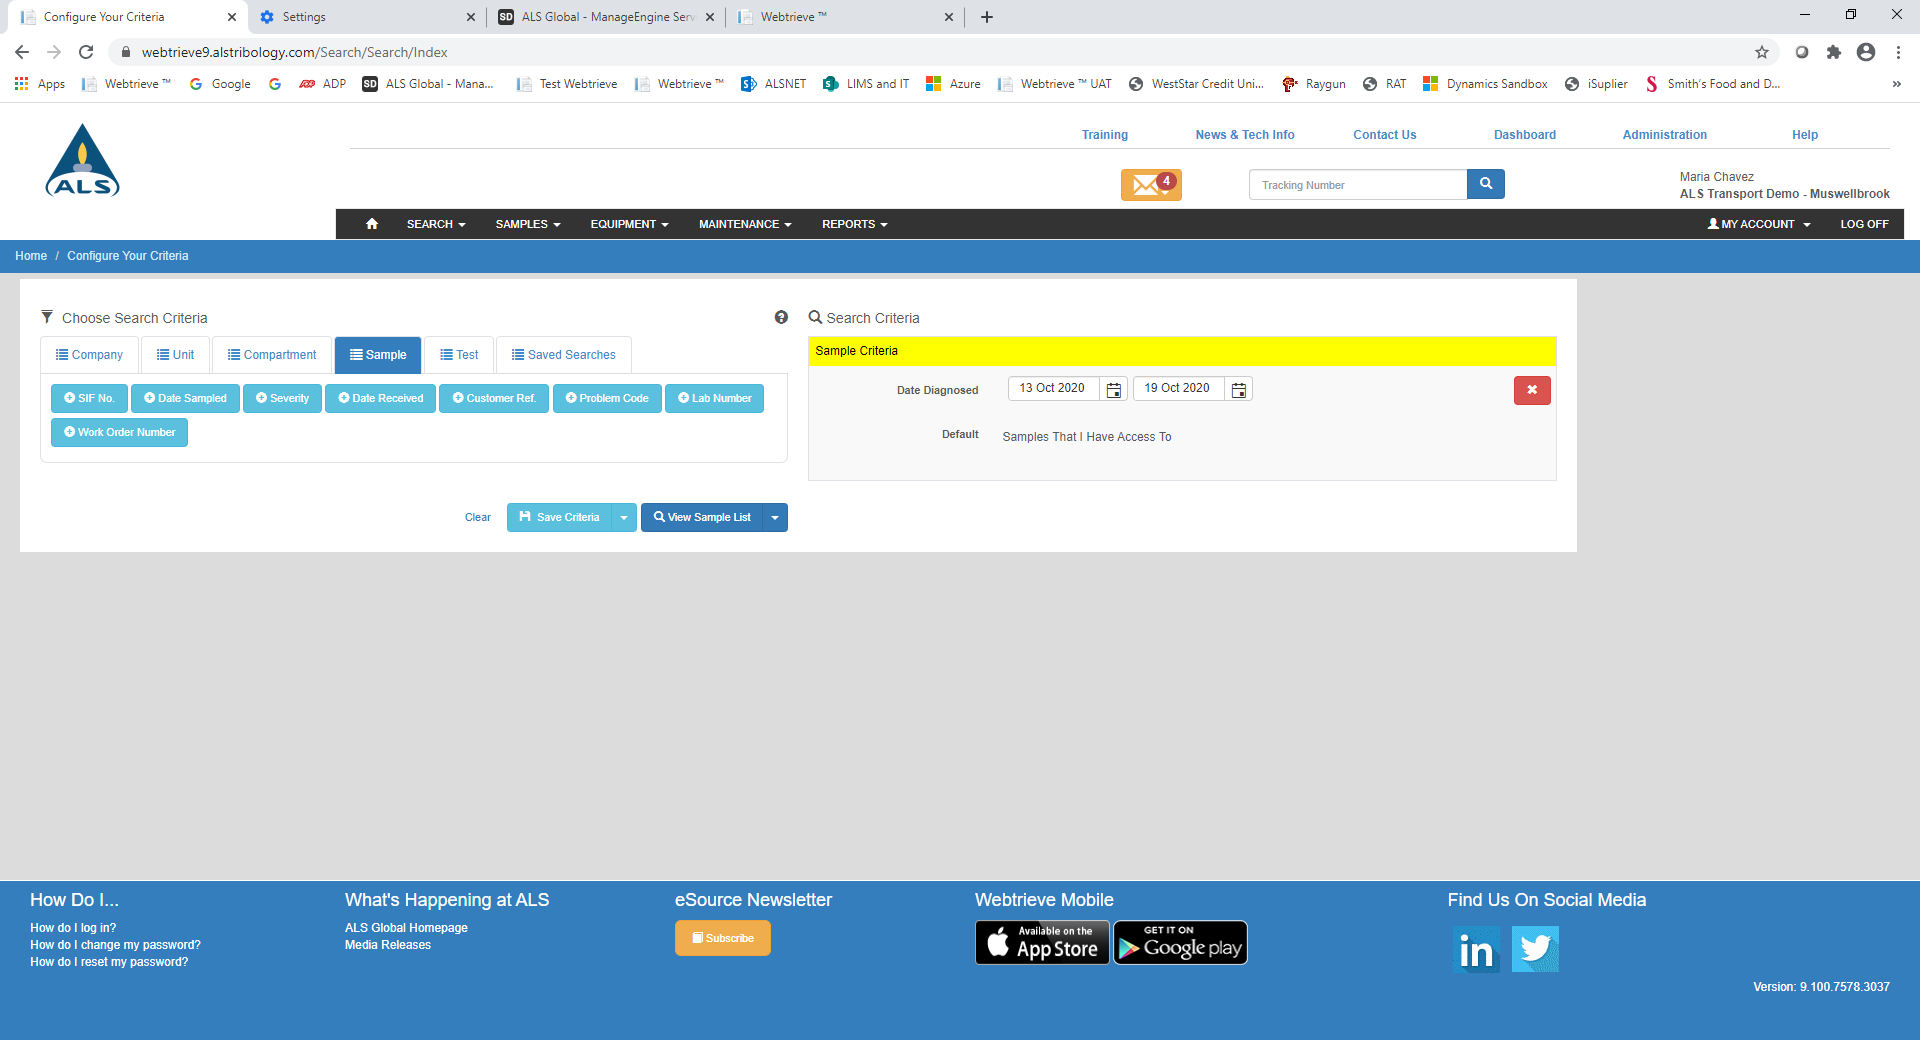
Search Criteria
Webtrieve helps the user access and utilize the web application system to receive valuable information about their equipment performance and contributes towards the goal of preventative maintenance.Webtrieve offers immediate access to a customer's historical data. The powerful search screen allows you to locate information using a very comprehensive and flexible range of criteria you provide. Selection filter criteria can range from an extensive list of company, unit and compartment information through to results of tests performed on the sample. Search criteria can be saved and created as fast track menu items providing one click access to specific lists of data.
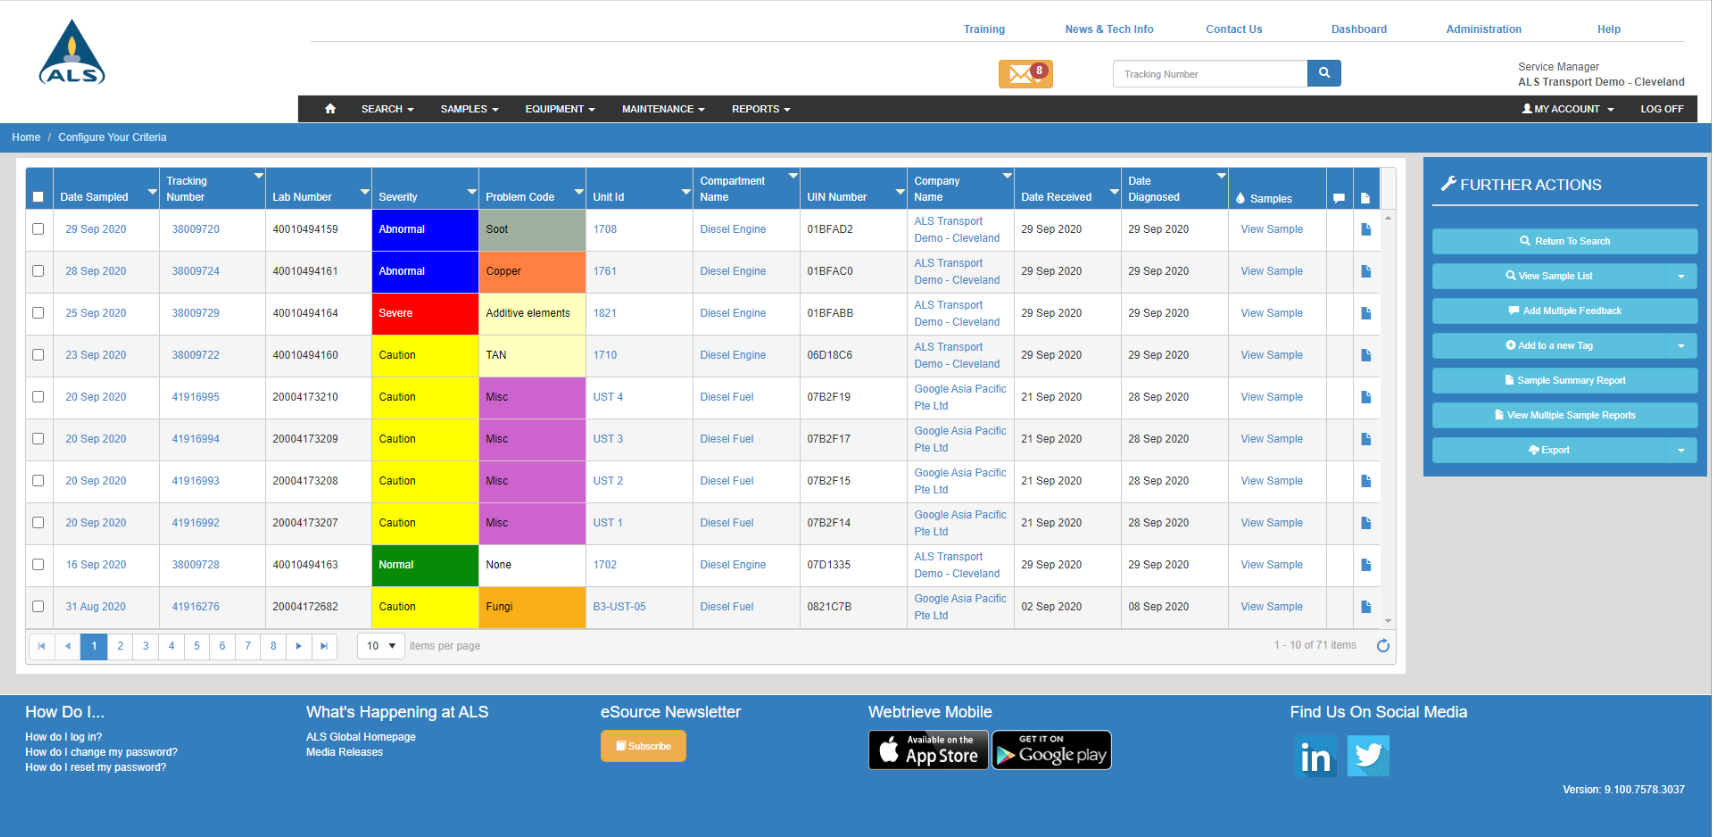
Search Results
Results returned from the search screen can be viewed from the Data List screen. The data list screen can display company, unit and compartment information. E.g. the company list allows you to easily review all units that belong to a company. And from the units you can view all compartments belonging to a unit and from the Compartment list you can view all the samples associated with the compartments.Each list can be customized to contain the information required by each user including the order in which data is to be displayed in the list table and how wide the column for the data should be.
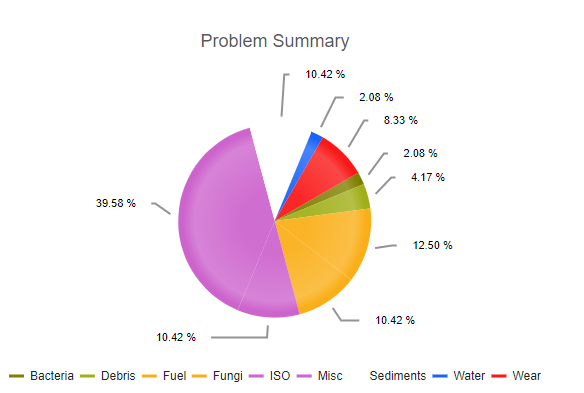
Dashboard
Dashboard in Webtrieve is different and can be configured as the user’s home page. The user can select the Companies to see results for them, can configure the Widget Visibility and can add a new widget as well.A number of widgets can be displayed on Dashboard which can be customized in three different types – Problem Summary, Condition Summary and Compartment Summary. Any number of widgets can be added for these three types by creating and utilizing search criteria.
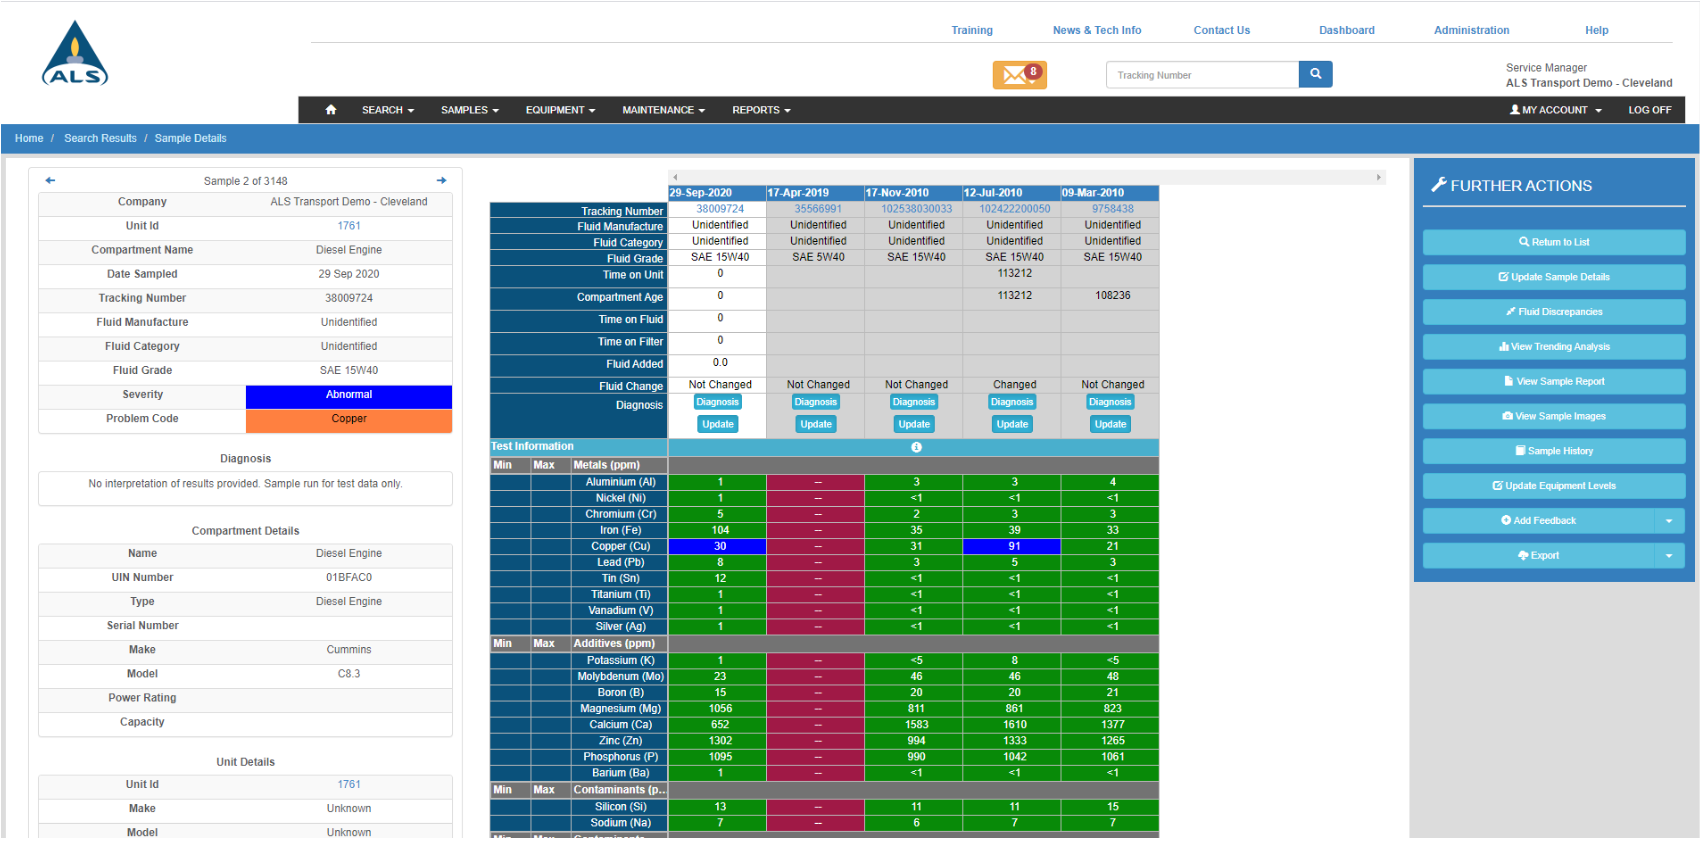
Sample Analysis
Actual sample test result details can be displayed by drilling down to a sample list record from any result list (Company/Unit/Compartment).Test results, their diagnosed severities, trending analysis graphs displaying historical element trends and sample images are available along with Sample Reports.
Discrepancies in fluid and equipment ages associated with a sample can be analyzed via the Sample Details screen. An edit facility also allows fluid ages, compartment ages and Diagnosis text to be modified. Updated values are recorded and processed after verification.
‘Return on Investment’ which allows you to provide feedback about the estimated savings done by the early detection of the problem.
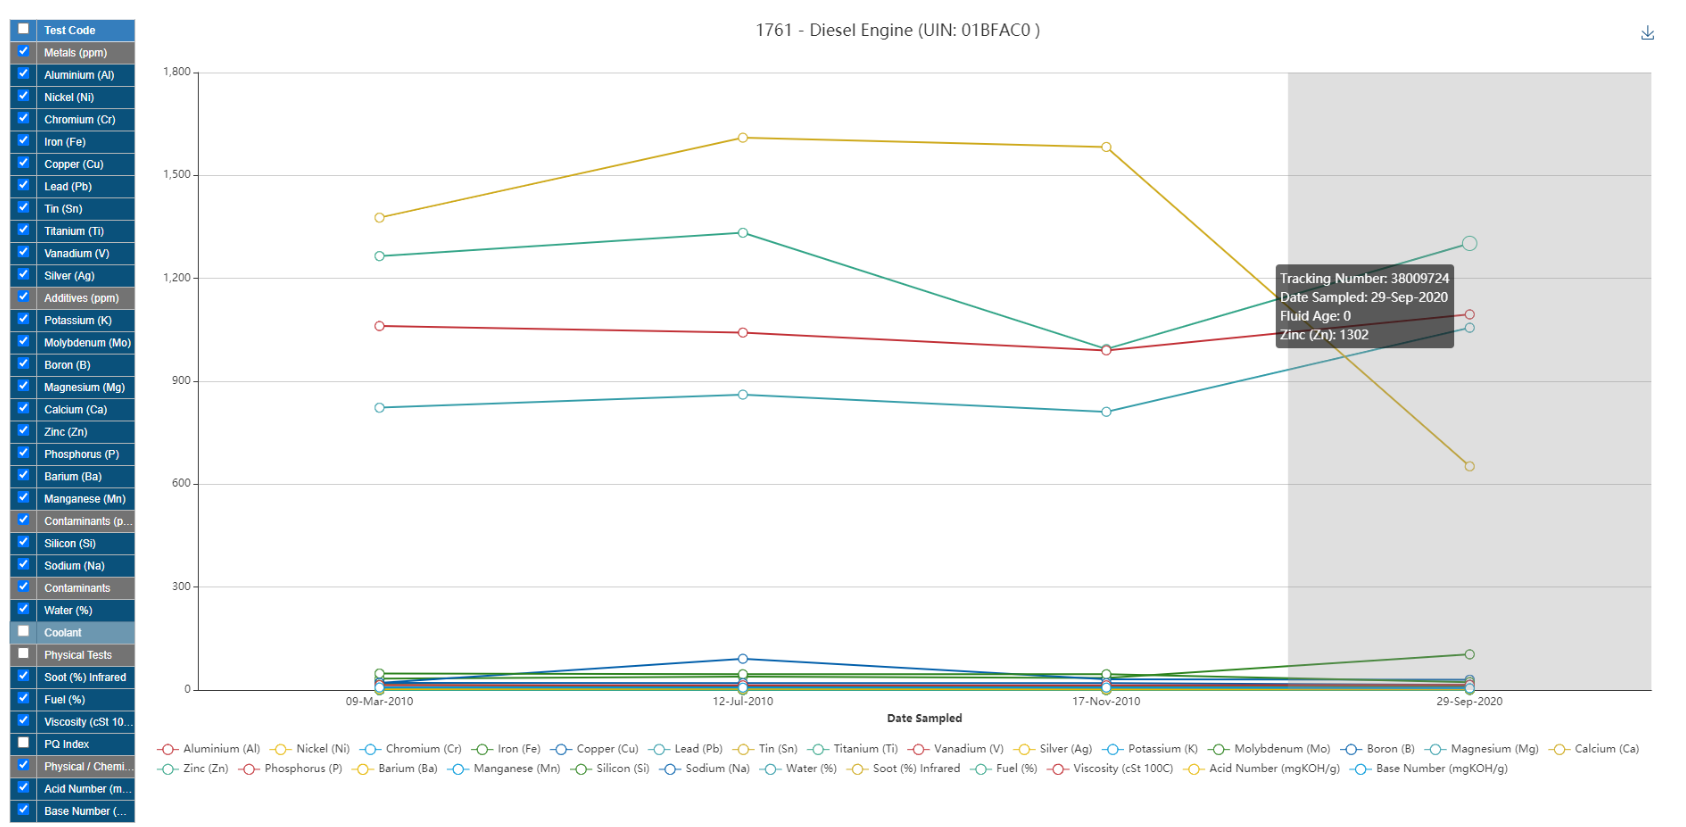
Trending Analysis
Trending analysis can be performed on equipment, allowing users to view, on a test-by-test basis, any trends in results over a specified period of time. Selectable tests include any performed on the equipment throughout its sample history.Trending Analysis include following features:
- The ability to view trends either graphically or in a tabular format.
- To view or hide fluid and filter changes done.
- Select any or all of the tests in a piece of equipment’s history for trending analysis.
- Deselect or select the tests on graphical analysis for a clearer view of trends.
- Select number of samples to be included in trending analysis.
- Download trending analysis results data in XML or CSV format.